前回からの続きです。
あやめの分類問題は素での正答率が高すぎたので、今回は同じくscikit-learn に含まれるワインのデータセットを使い、 k近傍法で予測を行います。
その後、説明変数の標準化を行ってから k近傍法で予測を行い、予測がどのように異なるか、標準化の効果を確認します。
ワインのデータセット
13個の説明変数からワインの品種(3種類)を予測するデータセットです。
それぞれの項目名は良く分かりません…。
標準化
平均が0、標準偏差(SD)が1になるように、全ての説明変数を変換します。
$$ z = \frac {x – \mu } {s} $$
この標準化された値は、Z得点とも呼ばれます。
標準化の必要性については下記が詳しいですが、k近傍法では一般的に標準化した方が良いと言われます。
距離を考えるのなら標準化した方がやりやすそうだなというのは、直感的に理解はできます。
ワインの分類問題を解く
まずは、普通にワインの分類問題を解きます。
データの読み込みと基本統計量の確認を行います。
In [1]: from sklearn import datasets
In [2]: wine = datasets.load_wine()
In [3]: import pandas as pd
In [4]: df = pd.DataFrame(wine.data, columns=wine.feature_names)
In [5]: df.describe()
Out[5]:
          alcohol  malic_acid         ash  ...         hue  od280/od315_of_diluted_wines      proline
count  178.000000  178.000000  178.000000  ...  178.000000                    178.000000   178.000000
mean    13.000618    2.336348    2.366517  ...    0.957449                      2.611685   746.893258
std      0.811827    1.117146    0.274344  ...    0.228572                      0.709990   314.907474
min     11.030000    0.740000    1.360000  ...    0.480000                      1.270000   278.000000
25%     12.362500    1.602500    2.210000  ...    0.782500                      1.937500   500.500000
50%     13.050000    1.865000    2.360000  ...    0.965000                      2.780000   673.500000
75%     13.677500    3.082500    2.557500  ...    1.120000                      3.170000   985.000000
max     14.830000    5.800000    3.230000  ...    1.710000                      4.000000  1680.000000
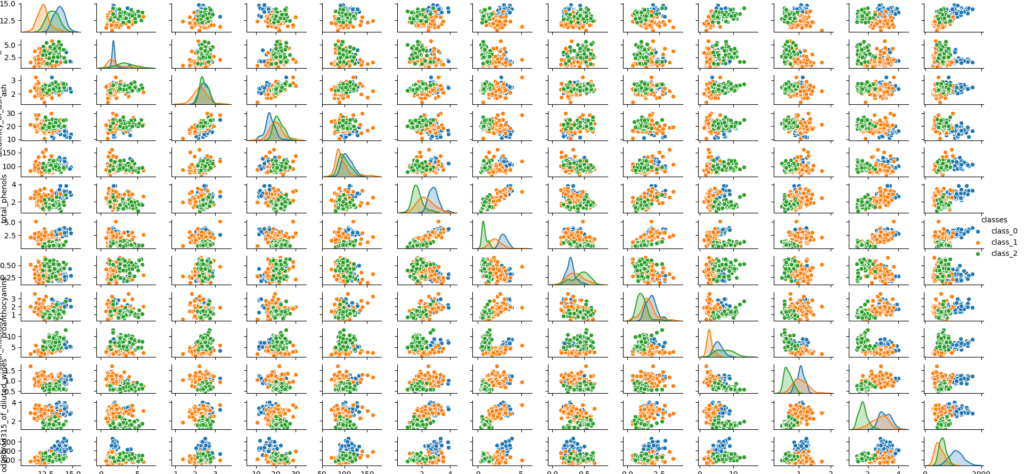
散布図行列を作成します。
In [11]: df['classes'] = np.array([wine.target_names[i] for i in wine.target])
    ...: sns.pairplot(df, hue='classes');
説明変数が多く細かいです。

データの分割を行います。
In [15]: from sklearn.model_selection import train_test_split
    ...: X_train, X_test, y_train, y_test = train_test_split(df[wine.feature_names],
    ...:                                                     wine.target,
    ...:                                                     test_size = 0.3,
    ...:                                                     stratify=wine.target,
    ...:                                                     random_state=0
    ...:                                                     )
学習を行います。
In [17]: from sklearn.neighbors import KNeighborsClassifier
    ...: knn = KNeighborsClassifier()
    ...: knn.fit(X_train, y_train)
Out[17]:
KNeighborsClassifier(algorithm='auto', leaf_size=30, metric='minkowski',
                     metric_params=None, n_jobs=None, n_neighbors=5, p=2,
                     weights='uniform')
予測とその評価を行います。
In [22]: knn.score(X_test, y_test)
Out[22]: 0.7222222222222222
In [24]: predicted = knn.predict(X_test)
    ...: from sklearn.metrics import confusion_matrix
    ...: confusion_matrix = pd.DataFrame(confusion_matrix(y_test, predicted),
    ...:                                 columns=wine.target_names,
    ...:                                 index=wine.target_names)
    ...: confusion_matrix
Out[24]:
         class_0  class_1  class_2
class_0       18        0        0
class_1        2       13        6
class_2        4        3        8
データを標準化しワインの分類問題を解く
データを標準化し、ワインの分類問題を解いてみます。
Python での標準化の実装方法は、下記に一通り載っています。
Pythonで正規化・標準化(リスト、NumPy配列、pandas.DataFrame)
不偏分散を使わないのはどうなのだろうか?という考えはありますが、ここでは、sickit-learn を使います。
sklearn.preprocessing.StandardScaler
In [32]: from sklearn.preprocessing import StandardScaler
    ...: scaler = StandardScaler()
    ...: scaler.fit(wine.data)
    ...: wine_data_std = scaler.transform(wine.data)
    ...: df_sd1 = pd.DataFrame(wine_data_std, columns=wine.feature_names)
    ...: df_sd1.describe()
Out[32]:
          alcohol    malic_acid           ash  alcalinity_of_ash     magnesium  total_phenols    flavanoids  nonflavanoid_phenols  proanthocyanins  color_intensity           hue  od280/od315_of_diluted_wines       proline
count  178.000000  1.780000e+02  1.780000e+02       1.780000e+02  1.780000e+02   1.780000e+02  1.780000e+02          1.780000e+02     1.780000e+02     1.780000e+02  1.780000e+02                    178.000000  1.780000e+02
mean     0.000000 -3.991813e-17  6.112464e-17       3.991813e-17 -3.991813e-17   2.395088e-16  7.983626e-17         -7.983626e-17     5.987720e-17     2.494883e-17 -1.995907e-16                      0.000000 -7.983626e-17
std      1.002821  1.002821e+00  1.002821e+00       1.002821e+00  1.002821e+00   1.002821e+00  1.002821e+00          1.002821e+00     1.002821e+00     1.002821e+00  1.002821e+00                      1.002821  1.002821e+00
min     -2.434235 -1.432983e+00 -3.679162e+00      -2.671018e+00 -2.088255e+00  -2.107246e+00 -1.695971e+00         -1.868234e+00    -2.069034e+00    -1.634288e+00 -2.094732e+00                     -1.895054 -1.493188e+00
25%     -0.788245 -6.587486e-01 -5.721225e-01      -6.891372e-01 -8.244151e-01  -8.854682e-01 -8.275393e-01         -7.401412e-01    -5.972835e-01    -7.951025e-01 -7.675624e-01                     -0.952248 -7.846378e-01
50%      0.061000 -4.231120e-01 -2.382132e-02       1.518295e-03 -1.222817e-01   9.595986e-02  1.061497e-01         -1.760948e-01    -6.289785e-02    -1.592246e-01  3.312687e-02                      0.237735 -2.337204e-01
75%      0.836129  6.697929e-01  6.981085e-01       6.020883e-01  5.096384e-01   8.089974e-01  8.490851e-01          6.095413e-01     6.291754e-01     4.939560e-01  7.131644e-01                      0.788587  7.582494e-01
max      2.259772  3.109192e+00  3.156325e+00       3.154511e+00  4.371372e+00   2.539515e+00  3.062832e+00          2.402403e+00     3.485073e+00     3.435432e+00  3.301694e+00                      1.960915  2.971473e+00
平均がほぼ0に、標準偏差がほぼ1に正規化されています。
同様に、下の関数も使ってみます。
In [33]: from sklearn.preprocessing import scale
    ...: df_sd2 = pd.DataFrame(wine.data, columns=wine.feature_names)
    ...: df_sd2.apply(scale, copy=False)
    ...: df_sd2.describe()
Out[33]:
          alcohol    malic_acid           ash  alcalinity_of_ash     magnesium  total_phenols  flavanoids  nonflavanoid_phenols  proanthocyanins  color_intensity           hue  od280/od315_of_diluted_wines     proline
count  178.000000  1.780000e+02  1.780000e+02         178.000000  1.780000e+02   1.780000e+02  178.000000            178.000000       178.000000     1.780000e+02  1.780000e+02                    178.000000  178.000000
mean     0.000000  1.197544e-16  3.243348e-17           0.000000 -3.991813e-17  -7.983626e-17    0.000000              0.000000         0.000000     2.494883e-17  3.991813e-17                      0.000000    0.000000
std      1.002821  1.002821e+00  1.002821e+00           1.002821  1.002821e+00   1.002821e+00    1.002821              1.002821         1.002821     1.002821e+00  1.002821e+00                      1.002821    1.002821
min     -2.434235 -1.432983e+00 -3.679162e+00          -2.671018 -2.088255e+00  -2.107246e+00   -1.695971             -1.868234        -2.069034    -1.634288e+00 -2.094732e+00                     -1.895054   -1.493188
25%     -0.788245 -6.587486e-01 -5.721225e-01          -0.689137 -8.244151e-01  -8.854682e-01   -0.827539             -0.740141        -0.597284    -7.951025e-01 -7.675624e-01                     -0.952248   -0.784638
50%      0.061000 -4.231120e-01 -2.382132e-02           0.001518 -1.222817e-01   9.595986e-02    0.106150             -0.176095        -0.062898    -1.592246e-01  3.312687e-02                      0.237735   -0.233720
75%      0.836129  6.697929e-01  6.981085e-01           0.602088  5.096384e-01   8.089974e-01    0.849085              0.609541         0.629175     4.939560e-01  7.131644e-01                      0.788587    0.758249
max      2.259772  3.109192e+00  3.156325e+00           3.154511  4.371372e+00   2.539515e+00    3.062832              2.402403         3.485073     3.435432e+00  3.301694e+00                      1.960915    2.971473
上とほぼ同じように標準化されました。
StandaerScaler を用いて標準化したデータを使い、学習、予測を行います。
データの分割、学習を行います。
In [35]: X_train, X_test, y_train, y_test = train_test_split(df_sd1[wine.feature_names],
    ...:                                                     wine.target,
    ...:                                                     test_size=0.3,
    ...:                                                     stratify=wine.target,
    ...:                                                     random_state=0)

In [36]: knn_std = KNeighborsClassifier()
    ...: knn_std.fit(X_train, y_train)
Out[36]:
KNeighborsClassifier(algorithm='auto', leaf_size=30, metric='minkowski',
                     metric_params=None, n_jobs=None, n_neighbors=5, p=2,
                     weights='uniform')
モデルの評価を行います。
In [46]: knn_std.score(X_test, y_test)
Out[46]: 0.9629629629629629

In [47]: predicted_std = knn_std.predict(X_test)
    ...: from sklearn.metrics import confusion_matrix
    ...: confusion_matrix_std = pd.DataFrame(confusion_matrix(y_test, predicted_std),
    ...:                                 columns=wine.target_names,
    ...:                                 index=wine.target_names)
    ...: confusion_matrix_std
Out[47]:
         class_0  class_1  class_2
class_0       18        0        0
class_1        1       19        1
class_2        0        0       15
今回の場合は、データの標準化を行うことで、正解率が 0.722から0.962へと劇的に改善しました。
